Learn how to understand the reading from a peak flow meter chart so you can better manage your asthma.
For many asthmatics, a peak flow meter is used in order to rate their best and worst breathing. A peak flow meter is an easy-to-use instrument, which generally is small enough to carry in your handbag or briefcase. It shows how well or how poor your lungs are working. It does this by measuring your peak expiratory flow. This tells how fast you can blow out air after an inhalation. You use the peak flow meter chart to help you identify lung performance patterns from day to day, which give you information to prevent asthma episodes and develop your asthma management plan. In order to create a chart, you simply record the numbers you get every time you use your peak flow meter.
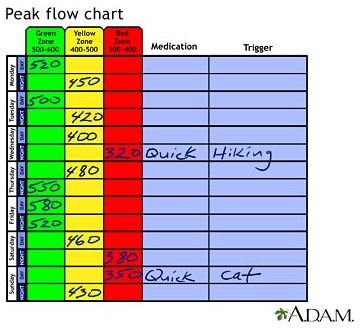
A peak flow chart is the recording of your peak flow readings over a certain time period. It would be similar to how a diabetic keeps a daily log of their glucose readings. The chart is broken into different sections. You have your days in one column in which you record the date. Then you have your green zone, yellow zone, and red zone. The green zone numbers are any numbers in which the slider on your peak flow meter is in the green. Your yellow zone numbers are when the slider is in the yellow area on the meter. These numbers generally are the cautionary zone, kind of like when a yellow light tells you to proceed with caution, so do these numbers. Red zone numbers are the dangerous numbers. They are the ones that tell you to STOP and have your emergency inhaler prepared. Now while your peak flow meter may have the different zones marked off, it is best to work with your doctor on your asthma management plan in order to know what your targets should be. In addition to the zones, your peak flow chart should also say what action you took when your peak flow readings were in the yellow and red zones. It should also say what caused your breathing to go down.
How do you use the chart to manage asthma?
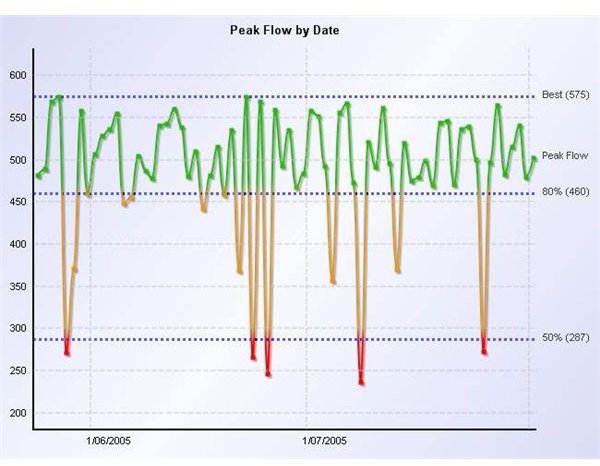
In both adults and children the peak flow meter charts can easily help manage asthma. By keeping a daily record not only of your peak flow meter readings but also the triggers of the changes, you can easily see where you can adjust your asthma management plan. If you notice that you or the child’s asthma (if you are the parent of the asthmatic or a caregiver to them) is being triggered by a neighbor mowing grass, you might want to bring that up to a doctor. He might be able to prescribe a long acting medication that is better for treating asthma caused by an allergen as opposed to say running. The time of day is also important because your asthma may be worse at a certain time of the day and bringing that up to your doctor may also help them better treat you asthma. With a peak flow chart, you have a documentation of changes in your breathing, which will help you prepare yourself better when you are around certain triggers.
Example Chart
References
E Medicine: https://emedicine.medscape.com/article/1413347-overview
National Jewish Health: https://www.nationaljewish.org/healthinfo/conditions/asthma/lifestyle-management/tools/peak-flow-meter.aspx
My Maine Care: https://www.mymainecare.com/documents/Adult%20Peak%20Flow%20Meter%20Chart.pdf
Image Credit